If you are not very familiar with the Query Store feature, please check my series of blog posts on Query Store here.
In this post, you are going to learn about the advancements of the Query Store released in SQL Server 2022. This is the first blog post for this series. You can expect more posts in the coming weeks related to the Query store usage in the Intelligent Query processing features released in SQL Server 2022.
Advancements in SQL Server 2022:
- Query Store enabled by Default – For any new databases that you create on SQL Server 2022, the Query Store feature is enabled by default. If you are migrating the database from lower versions to SQL Server 2022, the query store feature is not enabled by default. You need to manually enable it if the feature is not enabled manually on the lower version before. While choosing the configuration options, you need to make sure you capture only the required queries and not the insignificant queries that you do not bother capturing. To effectively capture the queries you need and save space for the Query Store data, you can customize the capture policy based on the total compile CPU time, total execution CPU time, and execution count. Example of the custom policy (source)
ALTER DATABASE [QueryStoreDB]

SET QUERY_STORE = ON

    (

      OPERATION_MODE = READ_WRITE,

      CLEANUP_POLICY = ( STALE_QUERY_THRESHOLD_DAYS = 90 ),

      DATA_FLUSH_INTERVAL_SECONDS = 900,

      MAX_STORAGE_SIZE_MB = 1000,

      INTERVAL_LENGTH_MINUTES = 60,

      SIZE_BASED_CLEANUP_MODE = AUTO,

      QUERY_CAPTURE_MODE = CUSTOM,

      QUERY_CAPTURE_POLICY = (

        STALE_CAPTURE_POLICY_THRESHOLD = 24 HOURS,

        EXECUTION_COUNT = 30,

        TOTAL_COMPILE_CPU_TIME_MS = 1000,

        TOTAL_EXECUTION_CPU_TIME_MS = 100

      )
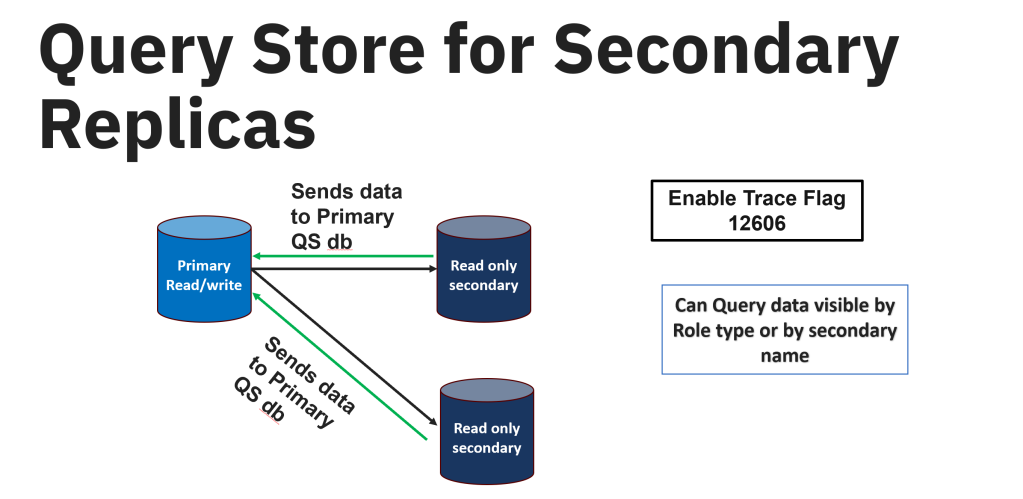
);2. Query Store on Secondary replicas – In SQL Server 2022, Query Store can also gather the information from the secondary replicas and send it over to the primary replica through the same channel that sends the data to the secondary replica. Once the data is captured and sent the data over to the primary replica, the data is hardened to the Query Store schema on the primary database. Query Store for secondary replicas is available for preview. It isn’t available for use in production environments.
You will need to enable the Trace flag 12606 before you enable the Query Store for secondary replicas.
There are some steps to follow in enabling the Query Store on secondary replica –
- The primary database should have the Query Store enabled on it and it should be in the read-write mode before enabling the Query Store on secondary replicas.
- Since the secondary replicas are all in read-only mode, you need to enable the Query store on the secondary replicas by connecting to the primary and running the below query on each database you would like to enable. This will enable the Query store for all the secondary databases.
ALTER DATABASE [Database_Name]

FOR SECONDARY SET QUERY_STORE = ON (OPERATION_MODE = READ_WRITE );

GO- To find more information about the replicas, you can use sys.query_store_replicas. You can find the replica_group_id, role_id, and replica_name.
3. Query Store Hints: We do have this feature available in Azure SQL database and Azure Managed Instance. It is also introduced in SQL Server 2022. When you have a query that will improve the performance with the query hint, you can use the Query store hints. Just like the regular query hint, it is the same way to use but the main important thing is that you do not have to change the underlying code of your query. You can use the system stored procedure designed for the Query Store hint sys.sp_query_store_set_hints.
You can use the Query store hints in the scenarios where the query needs to be recompiled, setting the MAXDOP, setting the memory size grants for your queries, compatability level at the query level, using specific kind of the joints like using Hash join in the place of the nested loop joins.
To see the example of how you can implement the Query Store hints, see my blog post on this here.
Some things to remember while using the Query Store hints:
- If you are using a force parameterization option at the database level, remember that the Query hint ‘RECOMPILE’ will be ignored. Any other query hints will be used and execute the query. When this happens, there will be a warning 12461 issued by the SQL Server.
- If there is any contradictory hints used while using the Query hints, simply the other hint will be ignored without issues with execution. The query will run fine.
- If you are already having any hints at the statement level or any plan guides on your queries, they will be ignored by the Query hints. Query hints will always override these.
- Prior versions of the SQL Server 2022 only captured the data using the Query store on the primary replica and Query Store hints are only applied to the primary replica but in SQL Server 2022 – once the secondary replicas are enabled to capture the data from Query Store, Query hints are replica aware for the secondary replicas.
4. Intelligent Query processing features in SQL Server 2022 – uses the Query Store data to capture the information overtime to capture the feedback and use that feedback for better performance of your queries. All the below highlighted features in blue were released in SQL Server 2022. To use these features, you just have to place the compatibility mode of the database to 160.
The only IQP feature released in SQL Server 2022 that doesn’t require the Query Store to be enabled is ‘Parameter Sensitive Plan Optimization” also known as PSP Optimization.

In the coming series of blog posts, I would like to go in detail of each of these IQP features with queries explaining how these features help in optimizing the performance of your queries and how Query Store help support these IQP features.
Thank you for reading!
References